Risk capacity
Table of Contents
In a previous post, we talked about asset allocation for retirement. To design an asset allocation for a financial goal for an investor, we need to understand time horizon of the goal and risk capacity for the investor. We discussed time horizon previously. Using time horizon, we can arrive at asset allocations for different goals. In this post, we will talk about risk capacity for the investor.
To me, risk capacity is how well I can sleep at night with the investments in my portfolio. It is a subjective ruler, different for each person. If I tend to worry about the investments, then my risk capacity is lower. When I worry, I am more likely to make irrational changes to the portfolio. However, if I choose more conservative investments, then its return will likely be lower. It makes sense to find a balance.
I have found this risk capacity survey by Index Fund Advisors (IFA) helpful to quantify the worry ruler. After answering the questions, it will return a number from 1 to 1001. The higher this number, the higher your risk appetite, i.e. able to take on higher risk. IFA has an asset allocation matching each number2. These are a family of portfolios with the following constituent funds:
- IFA US Large Company Index
- IFA US Large Cap Value Index
- IFA US Micro Cap Index
- IFA US Small Cap Value Index
- IFA Real Estate Index
- IFA International Value Index
- IFA International Small Company Index
- IFA International Small Cap Value Index
- IFA Emerging Markets Index
- IFA Emerging Markets Value Index
- IFA Emerging Markets Small Cap Index
- IFA One-Year Fixed Income Index
- IFA Two-Year Global Fixed Income Index
- IFA Five-Year Gov’t Income Index
- IFA Five-Year Global Fixed Income Index
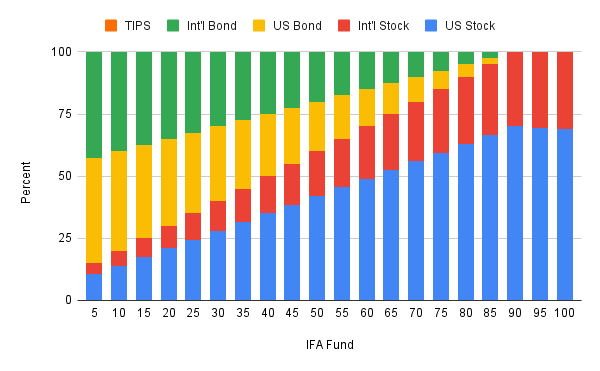
The asset allocations differ only by the constituent percentages. Here is a summary if grouped into 5 asset classes at each multiple-of-5 risk capacity number, i.e. IFA fund number.

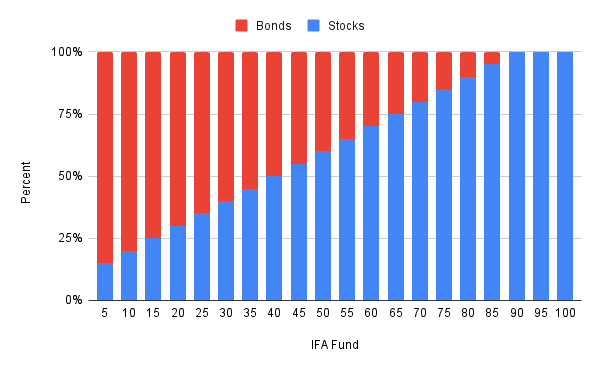
Again if grouped into only stock and bond classes.

We can see that the higher the fund number, the higher the percent in stocks. In other words, the higher the risk capacity, the higher the potential return.
We can use the 110-rule to find our equivalent, risk-adjusted age. The 110-rules is:
$$ stock\_percent = 110 - age $$
Therefore, the equivalent age is:
$$ equivalent\_age = 110 - stock\_percent $$
In a table:
| IFA Fund | Stock (%) | Equivalent age |
|---|---|---|
| 5 | 15 | 95 |
| 10 | 20 | 90 |
| 15 | 25 | 85 |
| 20 | 30 | 80 |
| 25 | 35 | 75 |
| 30 | 40 | 70 |
| 35 | 45 | 65 |
| 40 | 50 | 60 |
| 45 | 55 | 55 |
| 50 | 60 | 50 |
| 55 | 65 | 45 |
| 60 | 70 | 40 |
| 65 | 75 | 35 |
| 70 | 80 | 30 |
| 75 | 85 | 25 |
| 80 | 90 | 20 |
| 85 | 95 | 15 |
| 90 | 100 | 10 |
| 95 | 100 | 10 |
| 100 | 100 | 10 |
You can find your “equivalent age” using the survey result and above table. If your “equivalent age” is higher than your actual age, then you are more risk-averse than people in your age group. A portfolio with less stocks would be more appropriate for a good-night-sleep.
Back to this post’s opening: To design an asset allocation for a financial goal for an investor, we need to understand time horizon of the goal and risk capacity for the investor. We now have two asset portfolios: one from designing via time horizon and second via risk capacity. Which one to choose? It is your call3.
Footnotes #
My survey score was 100. This is why the IFA 100 asset allocation is discussed in this post. ↩︎
IFA used to publish assets allocation for every multiple-of-five fund number. They no longer do today (2022). However, the Internet Archive has past snapshots. Here is one for IFA 100: https://web.archive.org/web/20050612021001/http://www.ifa.com/portfolios/p100/ ↩︎
It is not a bad idea to create a hybrid of the two. I will leave that as homework for you. ↩︎