How to organize and visualize spending in Beancount

By labeling financial transactions with categories in Beancount, the tool automatically calculates the subtotals of each category, from which fava generates useful visualizations.
These categories are called accounts in Beancount. Accounts can have sub-accounts. For example:
Expenses:Food:Grocery
Expenses:Food:Restaurant
Here Grocery account is a child or sub-account of Food, which is a child or sub-account of Expenses. The subtotal of a parent is sum of local transactions and sum of all subtotals of its children. For example, the subtotal of Expenses:Food:Grocery is sum of all transactions labeled so. And similarly for the subtotal of Expenses:Food:Restaurant. Then the subtotal of Expenses:Food is sum of all transactions labeled so and its children’s subtotal. This rule repeats all the way up the account hierarchy.
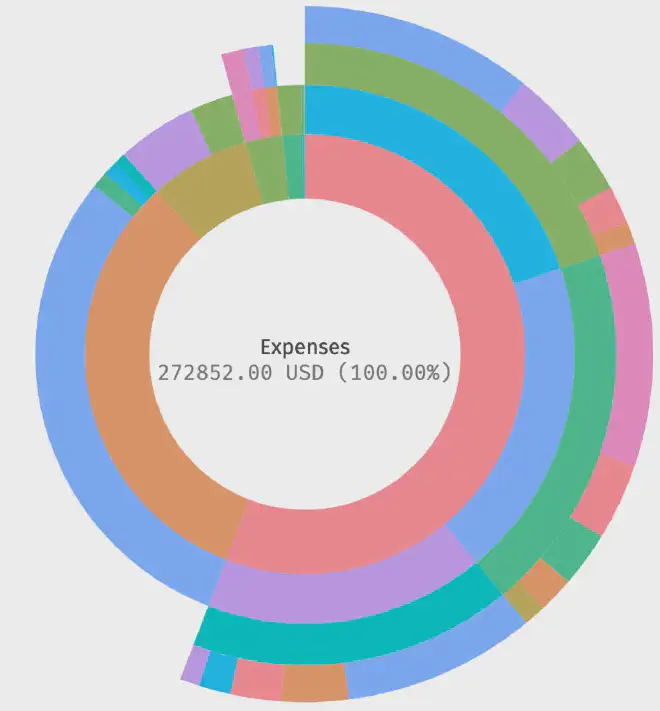
With such account hierarchy, the fava GUI for Beancount can generate informative plots such as a sunburst plot:

The outer ring are sub-accounts of the inner ring.
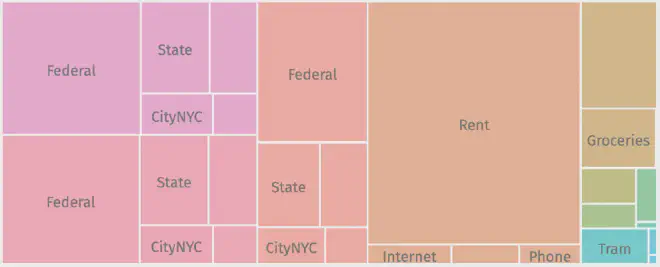
Or a treemap:

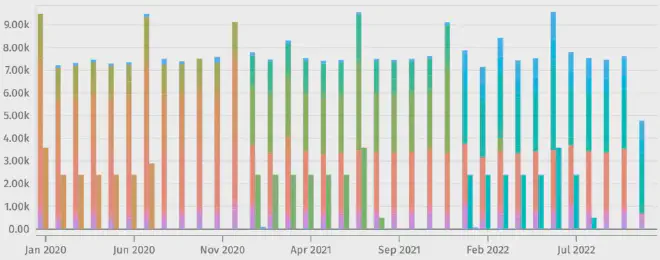
Or stacked bars over time:

The financial data above is an example generated by Beancount.
For me, I organize my expenses into the following major accounts and they are further split into more sub-accounts. My major accounts are:
- Education
- Food
- Home
- Financial
- Insurance
- Health
- Shopping
- Services
- Travel
- Unknown
Actual Beancount code: