Portfolio analysis for 2024
This is the annual portfolio analysis for 2024. The following portfolios are in this analysis:
- Vanguard 100 (2013)
- Vanguard 100 (2023)
- 80/20 1
- World 2
- S&P 500 3
The analysis tool is the rev24c backtesting spreadsheet by Simba et al. The year range in this analysis is from 1976 to 2024.

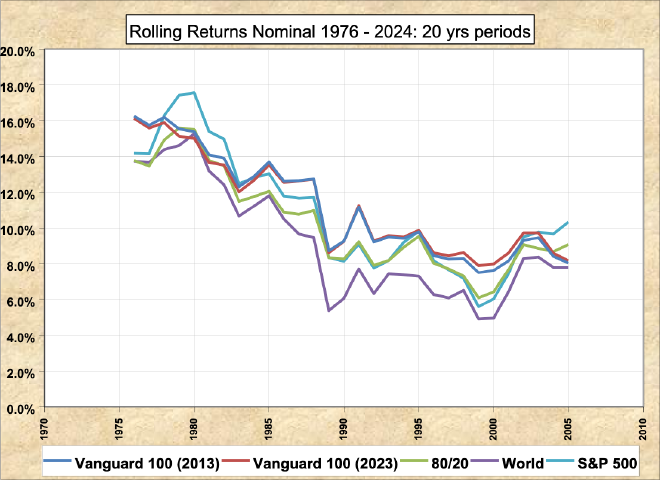
In the rolling returns chart, the year on the horizontal axis denotes the starting year of each period. Each period is 20 years. The vertical axis denotes the nominal annualized return of that period. For example, at year 2005, it denotes the nominal annualized return from 2005 to 2024.

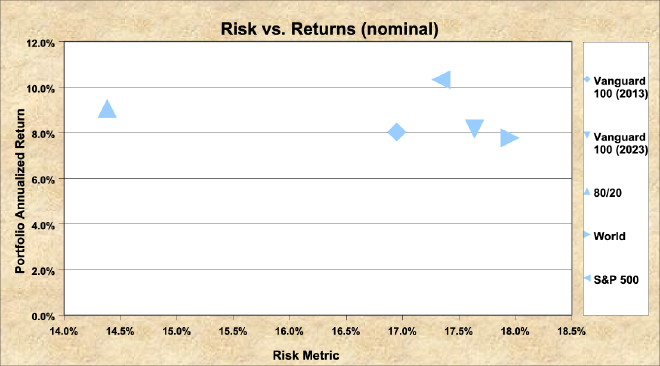
The risk vs return chart above covers the 20-year period from 2005 to 2024, which is the most recent rolling period from the previous chart. The Risk Metric is the standard deviation.
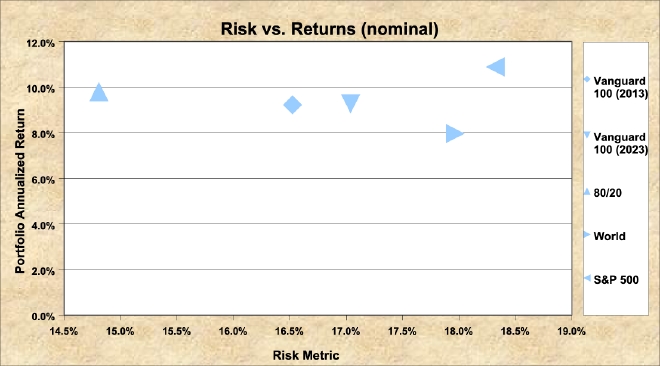
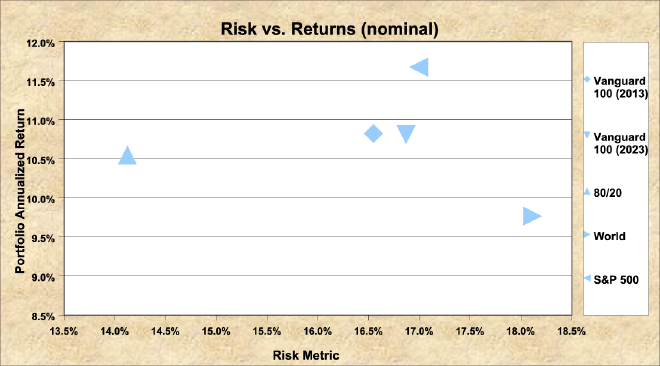
Now let’s see show what happens when the most recent rolling period is lengthened to 30-, 40- and 49-years.
30-year, from 1995 to 2024:

40-year, from 1985 to 2024:

49-year, from 1976 to 2024:

You might also be interested in:
- Getting better returns for your emergency fund.
- Analysis of portfolio glide paths.